CANARA ROBECO ELSS TAX SAVER (CRETS)
ELSS - An open ended equity linked saving scheme with a statutory lock in of 3 years and tax benefit
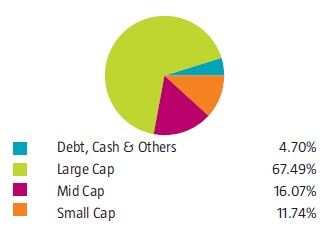
(as on May 31, 2024)
| SCHEME OBJECTIVE | ELSS seeking to provide long term capital appreciation by predominantly investing in equities to facilitate the subscribers to seek tax benefits as provided under Section 80 C of the Income Tax Act, 1961. However, there can be no assurance that the investment objective of the scheme will be realized. |
| DATE OF ALLOTMENT | March 31, 1993 |
| BENCHMARK* | BSE 500 Index TRI |
| FUND MANAGER | 1) Mr. Vishal Mishra 2) Mr. Shridatta Bhandwaldar |
| TOTAL EXPERIENCE | 1) 18 Years 2) 15 Years |
| MANAGING THIS FUND | 1) Since 26-June-21 2) Since 01-Oct-19 |
| ASSET ALLOCATION | Equity and equity related instruments - 80% to 100% (Risk - Very High) Money Market instruments- 0% to 20% (Risk- Low) |
| MINIMUM INVESTMENT | ₹ 500 and in multiples of ₹ 1 thereafter Subsequent purchases: Minimum amount of ₹ 500 and multiples of ₹ 1 thereafter SIP: For Any date/monthly frequency – ₹ 500 and in multiples of ₹ 1 thereafter For quarterly frequency – ₹ 1000 and in multiples of ₹ 1 thereafter STP: For Daily/Weekly/Monthly frequency – ₹ 500 and in multiples of ₹ 1 thereafter For quarterly frequency – ₹ 1000 and in multiples of ₹ 1 thereafter SWP: For monthly frequency – ₹ 500 and in multiples of ₹ 1 thereafter For quarterly frequency – ₹ 1000 and in multiples of ₹ 1 thereafter |
| PLANS / OPTIONS | Regular Plan - Payout of Income Distribution cum Capital Withdrawal Option Regular Plan - Growth Option Direct Plan Payout of Income Distribution cum Capital Withdrawal Option Direct Plan - Growth Option |
| ENTRY LOAD | Nil |
| EXIT LOAD | Nil |
| EXPENSE RATIO^: |
Regular Plan : 1.70% Direct Plan : 0.53% |
| Monthend AUM# | ₹ 7,925.68 Crores |
| Monthly AVG AUM | ₹ 7,824.97 Crores |
| (as on May 31, 2024) | (₹) |
| Direct Plan - Growth Option | 174.2700 |
| Regular Plan - Growth Option | 157.9800 |
| Regular Plan - IDCW (Payout) | 46.7700 |
| Direct Plan - IDCW (Payout) | 74.7800 |
| Standard Deviation | 11.74 |
| Portfolio Beta | 0.87 |
| Portfolio Turnover Ratio | 0.32 times |
| R-Squared | 0.92 |
| Sharpe Ratio | 0.78 |
Name of the Instruments |
% to NAV |
Equities |
95.30 |
Listed |
95.30 |
Banks |
17.36 |
HDFC Bank Ltd |
6.55 |
ICICI Bank Ltd |
5.69 |
State Bank of India |
2.43 |
Axis Bank Ltd |
2.17 |
IndusInd Bank Ltd |
0.52 |
IT - Software |
8.76 |
Infosys Ltd |
3.93 |
Tata Consultancy Services Ltd |
2.27 |
HCL Technologies Ltd |
0.96 |
Tech Mahindra Ltd |
0.58 |
Sonata Software Ltd |
0.55 |
Coforge Ltd |
0.47 |
Finance |
6.87 |
REC Ltd |
2.43 |
Bajaj Finance Ltd |
2.01 |
Cholamandalam Investment and Finance Co Ltd |
1.08 |
Creditaccess Grameen Ltd |
0.87 |
Jio Financial Services Ltd |
0.48 |
Petroleum Products |
5.13 |
Reliance Industries Ltd |
4.26 |
Bharat Petroleum Corporation Ltd |
0.87 |
Auto Components |
4.72 |
Samvardhana Motherson International Ltd |
2.17 |
Schaeffler India Ltd |
1.01 |
Uno Minda Ltd |
0.85 |
Sona Blw Precision Forgings Ltd |
0.69 |
Automobiles |
4.65 |
Tata Motors Ltd |
1.73 |
Bajaj Auto Ltd |
1.20 |
TVS Motor Co Ltd |
1.02 |
Maruti Suzuki India Ltd |
0.70 |
Electrical Equipment |
4.24 |
CG Power and Industrial Solutions Ltd |
1.28 |
ABB India Ltd |
1.12 |
Siemens Ltd |
0.95 |
GE T&D India Ltd |
0.89 |
Construction |
3.94 |
Larsen & Toubro Ltd |
3.08 |
KEC International Ltd |
0.86 |
Insurance |
3.46 |
ICICI Lombard General Insurance Co Ltd |
1.20 |
Medi Assist Healthcare Services Ltd |
1.03 |
Max Financial Services Ltd |
0.76 |
SBI Life Insurance Co Ltd |
0.47 |
Pharmaceuticals & Biotechnology |
3.21 |
Sun Pharmaceutical Industries Ltd |
1.41 |
Divi’s Laboratories Ltd |
0.98 |
J.B. Chemicals & Pharmaceuticals Ltd |
0.82 |
Aerospace & Defense |
2.90 |
Bharat Dynamics Ltd |
1.51 |
Bharat Electronics Ltd |
1.39 |
Power |
2.79 |
NTPC Ltd |
2.79 |
Telecom - Services |
2.67 |
Bharti Airtel Ltd |
2.67 |
Cement & Cement Products |
2.57 |
Ultratech Cement Ltd |
1.69 |
J.K. Cement Ltd |
0.88 |
Chemicals & Petrochemicals |
2.52 |
Deepak Nitrite Ltd |
0.86 |
Navin Fluorine International Ltd |
0.62 |
Linde India Ltd |
0.57 |
Vinati Organics Ltd |
0.47 |
Retailing |
2.20 |
Trent Ltd |
1.30 |
Vedant Fashions Ltd |
0.90 |
Diversified Fmcg |
1.88 |
ITC Ltd |
1.88 |
Personal Products |
1.75 |
Godrej Consumer Products Ltd |
0.97 |
Dabur India Ltd |
0.78 |
Industrial Manufacturing |
1.49 |
Titagarh Rail Systems Ltd |
1.49 |
Capital Markets |
1.35 |
Central Depository Services (India) Ltd |
0.77 |
BSE Ltd |
0.58 |
Consumable Fuels |
1.27 |
Coal India Ltd |
1.27 |
Realty |
1.25 |
Oberoi Realty Ltd |
1.25 |
Transport Services |
1.19 |
Interglobe Aviation Ltd |
1.19 |
Industrial Products |
1.11 |
KEI Industries Ltd |
1.11 |
Fertilizers & Agrochemicals |
0.97 |
PI Industries Ltd |
0.97 |
Household Products |
0.84 |
Jyothy Labs Ltd |
0.84 |
Consumer Durables |
0.79 |
Titan Co Ltd |
0.79 |
Agricultural Food & Other Products |
0.75 |
CCL Products (India) Ltd |
0.75 |
Textiles & Apparels |
0.73 |
K.P.R. Mill Ltd |
0.73 |
Healthcare Services |
0.70 |
Max Healthcare Institute Ltd |
0.70 |
Beverages |
0.68 |
United Spirits Ltd |
0.68 |
Entertainment |
0.56 |
PVR Inox Ltd |
0.56 |
Money Market Instruments |
4.61 |
TREPS |
4.61 |
Net Current Assets |
0.09 |
Grand Total ( Net Asset) |
100.00 |
| This product is suitable for investors who are seeking*: | |
|
|
 |
 Benchmark Riskometer (BSE 500 Index TRI) |
| *Investors should consult their financial advisers if in doubt about whether the product is suitable for them. | |
$ Source ICRA MFI Explorer | #Monthend AUM / Quantitative Information as on 31.5.2024 | ^The expense ratios mentioned for the schemes includes GST on investment management fees. Please click here for disclaimers. *Please refer notice cum addendum no.13 dated June 07, 2024 for Change in Benchmark of certain Schemes with effect from June 01, 2024