Economic Indicators (as on January 31, 2025)


Inflation in India (%)

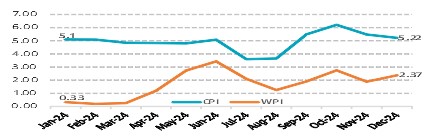
Consumer Price Index eases to 4-month low to 5.22% in Dec'24 from 5.48% in Nov'24 primarily due to a decline in food and beverage inflation. Wholesale Price Index (WPI) increased to 2.37% in Dec'24 from 1.89% in Nov'24 due to the rise in prices of manufactured items and a low base effect.

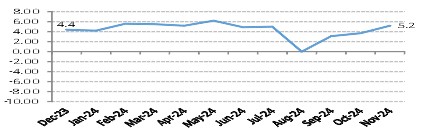
Index of Industrial Production (%)

Index of Industrial Production (IIP) accelerated to 6-months high of 5.2% in Nov’24 from 3.5% in Oct’24. Broad-based improvement in the manufacturing, electricity and mining output supported the overall IIP growth. The recovery was primarily supported by an improvement in the manufacturing sector output, which grew by 5.8% compared to 4.4% in Oct'24. Additionally, mining and electricity output grew by 1.9% and 4.4% respectively, further supporting the IIP rebound. Year-on-year increase was seen in 18 out of 23 subcategories.

Indian Business Indicators - Purchasing Managers' Index (PMI)

S&P Global India Manufacturing Purchasing Managers' Index (PMI) increased to 6-month high of 57.7 in Jan’25 from 56.4 in Dec’24. This rise was fuelled by the steepest upturn in exports and by new orders which rose at the quickest pace . PMI Services decrease to 56.5 in Jan ' 25 from 60.8 in Dec'24. India's services sector lost growth momentum in Jan'25, although the PMI remained well above the 50-break-even level. The reading remains in the expansion zone, as a score above 50 indicates expansion, while a score below 50 denotes contraction.

USD INR & Brent Crude Movement

Brent crude oil increased marginally to US$ 76.76 on Jan'25 end from US$ 74.64 on Dec'24 as China's manufacturing activity expanded for the third month in a row in Dec'24. Brent crude oil prices rose amid optimism about the outlook for global oil demand and the possibility of a supply shortage resulting from the sanctions imposed on crude oil exports from Iran and Russia. The Rupee closed the month on 86.6162 against Greenback as on Jan'25.

Equity Markets - India & US

Bellwether indices, Nifty 50 and S&P BSE Sensex moved during the month by -0.58% and -0.82% respectively amid rupee's record fall against the U.S. dollar, broad-based sell-off across the sectors on concerns over weak corporate earnings in Q3 FY’25 and continued foreign fund outflows. Foreign Institutional Investors (FIIs) were net sellers in Indian equities to the tune of ₹ -78027.13 crore. Gross Goods and Services Tax (GST) collections in Jan’25 stood at Rs. 1.96 trillion, second highest collection in the FY’25, mostly driven by festive demand, representing an 12.3% rise on a yearly basis and this points towards the growing trajectory of the Indian economy. Dow Jones increased sharply by 4.70% from previous month.

Interest Rate Movement (%) - India & US

Yield on the 10-Year benchmark paper remained range-bound, closing at 6.7% on Jan'25 vs 6.76% on Dec'24 aided by RBI's announcement of measures to address the bank liquidity shortage. The liquidity infusion package, which includes the purchase of bonds worth Rs. 60,000 crore in three tranches of Rs. 20,000 each. US 10 year G-Sec closed lower at 4.5387% on Jan’25 vs 4.569% on Dec’24.


Note : The data/statistics are given to explain general market trends, it should not be construed as any research report/research recommendation. The sector(s) mentioned are for the purpose of understanding only and the Fundmayormaynot have any future position in these sector(s).
Source: Bloomberg