Equity Markets - India & US
Bellwether indices, Nifty 50 and S&P BSE Sensex increased significantly during the month by 2.60% and 2.47% respectively on m-o-m basis majorly supported by strong corporate earnings season as well as RBI pausing consecutive rate hikes. Domestic retail inflation is below the Reserve Bank of India’s upper tolerance level of 6% in Apr’23 also added to positive sentiments in the markets. Goods and Services Tax (GST) collection stood at �1.57 lakh crore in May’23, highest ever, which is 12% more than the corresponding period of last year. Foreign Institutional Investors (FIIs) were net buyers in Indian equities to the tune of �43,838.15 crores this month. Dow Jones increased by -3.49% from previous month.

Interest Rate Movement (%) - India & US
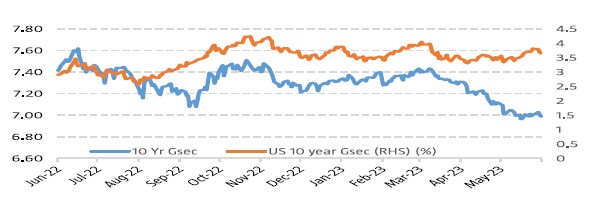
Yield on the 10-Year benchmark paper decreased slightly, closing at 6.99% on May'23 vs 7.119% on Apr'23 following Reserve Bank of India's (RBI) kept policy rates on hold in the first monetary policy review of FY24. Yields fell further after the RBI Governor said that countries holding excess rupees in their vostro accounts in India can invest the surplus in government securities and Treasury bills. U.S. Federal Reserve hinted at ending the rate hike cycle soon which also led to declined in bond yields. 10-year U.S. Treasury bond closed higher at 3.64% on May’23 vs 3.422% on Apr’23
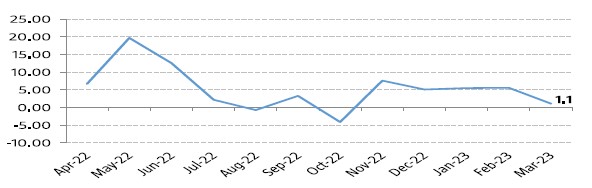
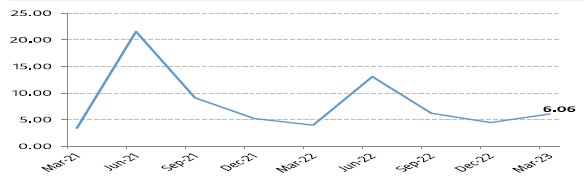
India GDP Growth Rate
India’s GDP growth hit it out of the park with 6.06% for Q4 FY23 vs 4.46% for Q3 FY23. Real GDP growth for the full year FY23 (Apr'22 to Mar'23) came in at 7.2% y-o-y. This GDP growth came in much higher than expected as Agriculture growth was extremely strong, growing 5.5% y-o-y. The disruption caused by the unseasonal rains at end-March may show up in the next quarter. Manufacturing grew faster than the industrial production data. Construction activity rose quickly. This also links up well with the impressive rise in fixed investment. We attribute much of this to central and state government capex picking up in the March quarter. Finally, exports were buoyant, led more by services than goods. In fact, the percentage point contribution of net exports to GDP growth came in at a positive 1.4ppts.
Note : The data/statistics are given to explain general market trends, it should not be construed as any research report/research recommendation. The sector(s) mentioned are for the purpose of understanding only and the Fund may or may not have any future position in these sector(s).
Source: Bloomberg