Economic Indicators (as on July 31, 2023)


Inflation in India (%)

Consumer Price Index rises for the first time in 5 months of 4.81% in Jun’23 from 4.31% in May’23, largely due to rise in food inflation. Nevertheless, retail inflation is below the Reserve Bank of India’s upper tolerance level of 6%. Wholesale Price Index (WPI) cools down to nearly 8-year low to -4.12% in Jun’23 from -3.48% in May’23, primarily contributed by fall in the prices of mineral oils, basic metals, crude petroleum and natural gas, and fuel and power. This is the 13th straight month of decline in WPI-based inflation.

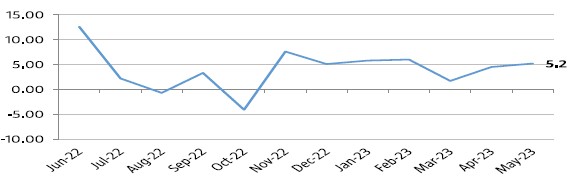
Index of Industrial Production (%)

Index of Industrial Production (IIP) jumps to 3 months high of 5.2% in May’23 from 4.5% in Apr’23 primarily owing to above average performance of the mining and manufacturing sectors. Power sector saw a marginal growth of 0.9% whereas manufacturing sector and mining sector grew by 5.7% and 6.4% respectively.

Indian Business Indicators - Purchasing Managers' Index (PMI)

S&P Global India Manufacturing Purchasing Managers' Index (PMI) marginally softened to 3 month low of 57.7 in Jul’23 from 57.8 in Jun’23 attributable to higher inflationary pressures despite robust demand. The sector benefitted from sharp rise in new orders and output driven by both domestic and global demand. PMI Services increased sharply to 13 year high of 62.3 in Jul’23 from 58.5 in Jun’23 due to increase in sales across the domestic and international markets. The reading remains in the expansion zone as a print above 50 means expansion while a score below 50 denotes contraction.

USD INR & Brent Crude Movement

Brent crude oil stood at ~US$ 85.56 on improved prospects for global growth and energy demand. The increase in the prices was even because of escalating geopolitical tensions between Russia and Ukraine. The Rupee closed the month on 82.25 against Greenback as on Jul'23.


Equity Markets - India & US

Bellwether indices, Nifty 50 and S&P BSE Sensex increased significantly during the month by 2.94% and 2.80% respectively on m-o-m basis majorly supported by firm cues from the global markets with strong foreign fund inflows boosting market sentiments. Domestic retail inflation is below the Reserve Bank of India’s upper tolerance level of 6% in Jun’23 also added to positive sentiments in the markets. Goods and Services Tax (GST) collection stood at ₹ 1.65 lakh crore in Jul’23, which is 11% more than the corresponding period of last year. Foreign Institutional Investors (FIIs) were net buyers in Indian equities to the tune of ₹ 46,617.83 crores this month. Dow Jones increased by 3.35% from previous month.

Interest Rate Movement (%) - India & US

Yield on the 10-Year benchmark paper increased marginally, closing at 7.18% on Jul'23 vs 7.12% on Jun'23 following rise in yields on U.S. Treasuries, domestic inflationary pressures also added to the increase in the yields. 10-year U.S. Treasury bond closed higher at 3.96% on Jul’23 vs 3.84% on Jun’23.

Note : The data/statistics are given to explain general market trends, it should not be construed as any research report/research recommendation. The sector(s) mentioned are for the purpose of understanding only and the Fund may or may not have any future position in these sector(s).

Source: Bloomberg