Economic Indicators (as on August 31, 2023)


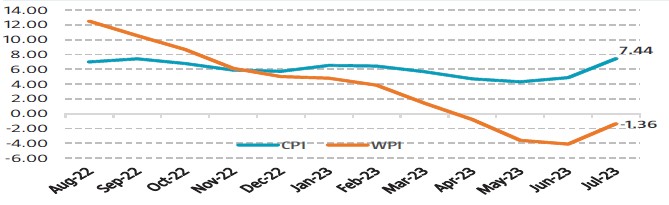
Inflation in India (%)

Consumer Price Index rises to 15 months of 7.44% in Jul’23 from 4.81% in Jun’23, largely due to rise in food inflation. The recent spike in tomato and other vegetable prices across India may be partially to blame for the most recent increase in inflation. Retail inflation is above the Reserve Bank of India’s upper tolerance level of 6%. Wholesale Price Index (WPI) rises to -1.36% in Jul’23 from -4.12% in Jun’23, primarily contributed by rise in the prices of vegetables. WPI remained in the deflationary zone for the fourth month in a row.

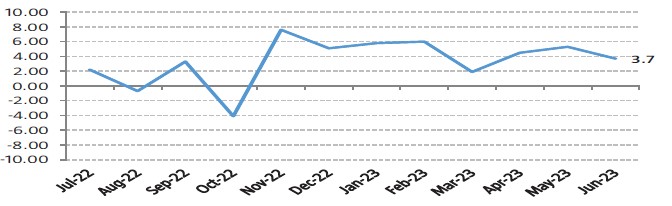
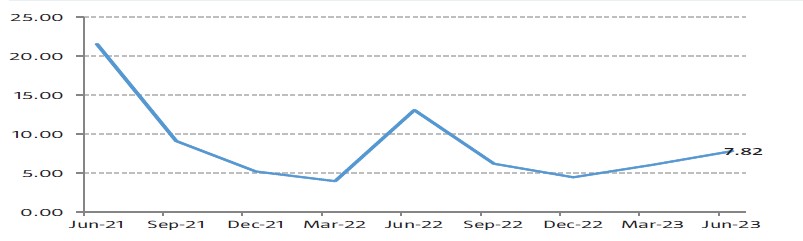
Index of Industrial Production (%)

Index of Industrial Production (IIP) declines to 3 months low of 3.7% in Jun’23 from 5.3% in May’23 primarily due to poor showing by the manufacturing sector which witnessed a growth of 3.1%. Power sector saw some improvement with a growth of 4.2% whereas mining sector grew by 7.6%.

Indian Business Indicators - Purchasing Managers' Index (PMI)

S&P Global India Manufacturing Purchasing Managers' Index (PMI) rises to 3 month high of 58.6 in Aug’23 from 57.7 in Jul’23. The sector benefitted from sharp rise in new orders and output driven by both domestic and global demand. The manufacturing PMI has now spent 26 consecutive months above the key level of 50. PMI Services decreased to 60.1 in Aug’23 from 62.3 in Jul’23. However, this data also showed that Indian exports were at a record high amidst strong international demand of Indian goods. The reading remains in the expansion zone as a print above 50 means expansion while a score below 50 denotes contraction.

USD INR & Brent Crude Movement

Brent crude oil stood at ~US$ 86.86 on improved prospects for global growth and energy demand and tightening supplies. The increase in the prices was because U.S. crude inventories fell more than expected and there was growing possibility that the OPEC+ group of oil producers would extend output cuts to the end of the year. The Rupee closed the month on 82.785 against Greenback as on Aug'23.


Equity Markets - India & US

Bellwether indices, Nifty 50 and S&P BSE Sensex decreased significantly during the month by -2.53% and -2.55% respectively on m-o-m basis majorly on concerns that domestic inflationary pressures may rise which may prevent the Reserve Bank of India to lower interest rates this year. Domestic retail inflation is above the Reserve Bank of India’s upper tolerance level of 6% in Jul’23 also added to negative sentiments in the markets. Goods and Services Tax (GST) collection stood at ₹1.59 lakh crore in Aug’23, which is 11% more than the corresponding period of last year. Foreign Institutional Investors (FIIs) were net buyers in Indian equities to the tune of ₹12262.46 crores this month. Dow Jones decreased by -2.36% from previous month.

Interest Rate Movement (%) - India & US

Yield on the 10-Year benchmark paper remained range-bound, closing at 7.164% on Aug'23 vs 7.18% on Jul'23 following decline in the U.S. Treasury yields on hawkish commentary by the U.S. Federal Reserve. Sentiments were also boosted following the government's announcement of a new 10-year bond. 10-year U.S. Treasury bond closed higher at 4.1081% on Aug’23 vs 3.96% on Jul’23.

India GDP Growth Rate

India’s GDP growth hit it out of the park with 7.82% for Q1 FY24 vs 6.06% for Q4 FY23 supported by healthy government capital expenditure, improved investment activity and the low base of the same quarter last year. On the sectoral front, the growth of the manufacturing sector slowed to 4.7% in Q1 of FY24 from 6.1% in same quarter of previous fiscal year. However, growth of Agriculture, Forestry & Fishing improved to 3.5% in Q1 of FY24 from 2.4% in Q1 of FY23. Also, growth of Financial, Real Estate & Professional Services accelerated to 12.2% in Q1 of FY24 from 8.5% in Q1 of FY23. This GDP growth came in much higher than expected as robust momentum in domestic demand conditions continues to reflect in the GDP numbers, which have surprised on the upside for two consecutive quarters, citing firm GST collections, credit growth and Purchasing Managing Index.


Note : The data/statistics are given to explain general market trends, it should not be construed as any research report/research recommendation. The sector(s) mentioned are for the purpose of understanding only and the Fund may or may not have any future position in these sector(s).

Source: Bloomberg