Economic Indicators (as on November 30, 2023)


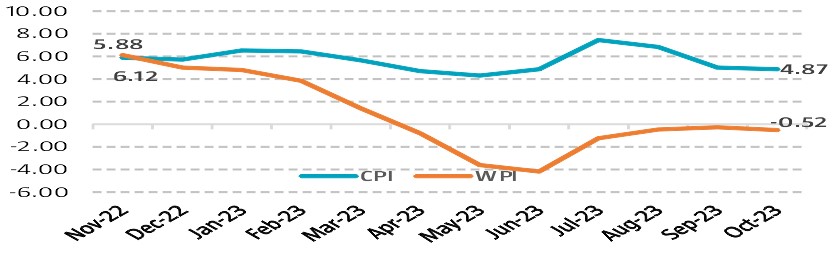
Inflation in India (%)

Consumer Price Index eased to 4.87% in Oct’23, lowest in 5 months, from 5.02% in Sep’23, thanks to the combination of a favourable base effect and cooling prices of some food items. Retail inflation is below the Reserve Bank of India’s upper tolerance level of 6%. Wholesale Price Index (WPI) is -0.52% in Oct’23 from -0.26% in Sep’23, it remained negative for the 7th consecutive month but the contraction was narrower compared with the previous months due to a mild uptick in crude oil, natural gas and power prices.

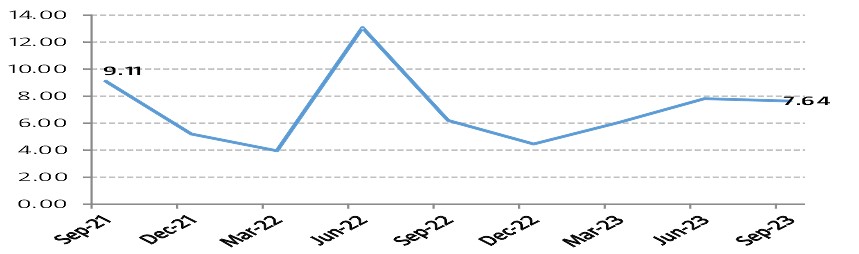
Index of Industrial Production (%)

Index of Industrial Production (IIP) falls to 3 months low of 5.8% in Sep’23 from 10.3% in Aug’23 due to a significant deceleration in key sectors namely manufacturing sector growing by 4.5%, mining sector growing by 11.5% and electricity growing by 9.9%.

Indian Business Indicators - Purchasing Managers' Index (PMI)

S&P Global India Manufacturing Purchasing Managers' Index (PMI) grew to of 56 in Nov’23 from 55.5 in Oct’23 due to substantial easing of price pressures as input cost inflation slipped to 40-month low. The ability of firms to acquire new businesses both domestically and internationally continued to be essential to the industry's development.The manufacturing PMI has now spent 29 consecutive months above the key level of 50. PMI Services decreased to 1 year low of 56.9 in Oct’23 from 58.4 in Oct’23, amid subdued demand. Though the reading remains in the expansion zone as a print above 50 means expansion while a score below 50 denotes contraction.

USD INR & Brent Crude Movement

Brent crude oil stood at ~US$ 82.83 on signs of slowing demand in China and worries of a slowdown in global growth hit the demand outlook of the commodity. The decrease in the prices was because U.S. crude inventories increased more than expected. The Rupee closed the month on 83.395 against Greenback as on Nov'23.


Equity Markets - India & US

Bellwether indices, Nifty 50 and S&P BSE Sensex increased significantly during the month by 5.52% and 4.87% respectively on m-o-m basis following upbeat quarter end earning numbers, U.S. Federal Reserve kept interest rates on hold for the third consecutive time, fall in global crude oil prices and strong GDP data in the second quarter of FY’24 added to the gains. Foreign Institutional Investors (FIIs) were net buyers in Indian equities to the tune of `₹9000.88 crores this month. Domestic retail inflation is within the Reserve Bank of India’s upper tolerance level of 6% in Oct’23. Goods and Services Tax (GST) collection stood at `₹1.68 lakh crore in Nov’23, which is 15% more than the corresponding period of last year. Dow Jones decreased by 8.77% from previous month.

Interest Rate Movement (%) - India & US

Yield on the 10-Year benchmark paper remained range-bound, closing at 7.28% on Nov'23 vs 7.355% on Oct'23 following the drop in U.S. treasury yields after softer than expected consumer inflation data and fall in crude oil prices. Sentiments were also boosted following the government's announcement of a new 10-year bond. 10-year U.S. Treasury bond closed higher at 4.3264% on Nov’23 vs 4.9307% on Oct’23.


India GDP Growth Rate

India’s GDP growth hit it out of the park with 7.64% for Q2 FY24 vs 7.82% for Q1 FY24, remaining the fastest growing economy in the world, it was supported by various factors like robust corporate profits, a strong fiscal impulse, with government spending being front-loaded in a pre-election year. On the sectoral front, the growth of the manufacturing sector soared to 13.9% in Q2 of FY24 from a negative 3.8% in same quarter of previous fiscal year. However, growth of Agriculture, Livestock, Forestry & Fishing slowed to 1.2% in Q2 of FY24 from 2.5% in Q2 of FY23. This GDP growth came in much higher than expected as robust momentum in domestic demand conditions continues to reflect in the GDP numbers, which have surprised on the upside for three consecutive quarters, citing firm GST collections, credit growth and Purchasing Managing Index.


Note : The data/statistics are given to explain general market trends, it should not be construed as any research report/research recommendation. The sector(s) mentioned are for the purpose of understanding only and the Fundmayormaynot have any future position in these sector(s).